
Support and Resistance Basics – Nifty50, Sensex, Bank Nifty, Gold, Cruid Oil, Silver
Support and resistance are among the most fundamental concepts in technical analysis. Whether you trade indices like Nifty50, Sensex, Bank Nifty, or commodities such as Gold and Crude Oil, understanding these price levels can significantly improve your decision-making and risk management.
This guide explains support and resistance in simple terms and shows how traders apply them across different markets.
What is Support?
Resistance is a price level where an asset struggles to move higher and may reverse downward. Sellers become active at this level.
In simple terms:
Resistance = Supply Zone (Sellers Active)
Example:
If Bank Nifty fails to cross 48,000 multiple times, 48,000 becomes resistance.
What is Resistance?
Resistance is a price level where an asset struggles to move higher and may reverse downward. Sellers become active at this level.
In simple terms:
Resistance = Supply Zone (Sellers Active)
Example:
If Bank Nifty fails to cross 48,000 multiple times, 48,000 becomes resistance.
Why Support and Resistance Work
Markets move based on psychology:
- Traders remember past price levels
- Institutions place large orders around key zones
- Fear and greed create repeated reactions
Because of this, historical price levels often influence future price movements.
Types of Support and Resistance
1. Horizontal Support and Resistance
The most common type. Price reacts repeatedly at similar levels.
2. Trendline Support and Resistance
Used in trending markets by connecting higher lows or lower highs.
3. Moving Average Support and Resistance
Indicators like 20 EMA, 50 EMA, or 200 EMA often act as dynamic levels.
4. Psychological Levels
Round numbers such as:
- Nifty: 22,000
- Bank Nifty: 50,000
- Gold: $2,000
- Crude Oil: $100
These attract strong reactions.
Support and Resistance in Major Markets
Nifty50
Nifty is influenced by institutional participation and sector rotation.
Common observations:
- Previous day high/low acts as intraday levels
- Weekly highs and lows are strong swing levels
- Option chain data often aligns with support and resistance zones
Traders often combine price action with open interest data for better accuracy.
Sensex
Sensex behaves similarly to Nifty but sometimes moves with higher volatility due to fewer constituent stocks.
Key levels include:
- Round numbers (70,000, 75,000)
- Previous swing highs and lows
- Gap zones on charts
Bank Nifty
Bank Nifty is known for strong momentum and sharp moves.
Important characteristics:
- Quick breakouts and fakeouts
- Institutional activity near expiry
- High reaction near option strike prices
Because of volatility, traders prefer confirmation before entering trades.
Gold
Gold is a globally traded commodity influenced by:
- US Dollar strength
- Interest rates
- Geopolitical events
- Inflation data
Support and resistance in gold often form around:
- Previous weekly highs/lows
- Major psychological levels
- Trendline zones
Gold tends to respect technical levels well due to institutional trading.
Crude Oil
Crude oil is highly sensitive to news events like:
- OPEC decisions
- Supply disruptions
- Global demand forecasts
Crude frequently shows strong reactions at:
- Supply-demand imbalance zones
- Previous consolidation ranges
- Round numbers
Volatility is high, so risk management is critical.
How Traders Use Support and Resistance
1. Buying Near Support
Strategy:
- Price approaches support
- Rejection candle forms
- Enter long with stop loss below support
2. Selling Near Resistance
Strategy:
- Price reaches resistance
- Weak momentum or reversal pattern appears
- Enter short with stop loss above resistance
3. Breakout Trading
When price breaks a strong level with volume:
- Resistance becomes new support
- Support becomes new resistance
This is called role reversal.
Common Mistakes Traders Make
Many beginners misuse support and resistance.
Avoid these errors:
- Treating levels as exact prices instead of zones
- Ignoring market trend
- Entering trades without confirmation
- Not using stop loss
- Drawing too many lines on charts
Professional traders focus only on key levels.
Best Timeframes for Drawing Levels
Different traders use different timeframes:
- Scalpers: 5-minute and 15-minute charts
- Intraday traders: 15-minute and 1-hour charts
- Swing traders: Daily and weekly charts
Higher timeframe levels are usually stronger.
Pro Tips for Better Accuracy
Experienced traders combine support and resistance with:
- Price action patterns
- Volume analysis
- Moving averages
- RSI or momentum indicators
- Market structure (higher highs, lower lows)
Confluence increases probability.
Risk Management is Essential
Even strong levels fail sometimes.
Always:
- Use stop loss
- Maintain proper risk-reward ratio
- Avoid over-leveraging
- Follow discipline
Trading success depends more on risk control than prediction accuracy.
Conclusion
Support and resistance form the backbone of technical analysis across all markets — Nifty50, Sensex, Bank Nifty, Gold, and Crude Oil. These levels help traders identify entry points, exit zones, and risk management areas.
Mastering them requires practice, chart observation, and patience.
If you consistently apply support and resistance with discipline, your trading decisions can become more structured and confident.
Note:- Focus on learning price behavior around levels rather than predicting direction. Markets reward patience and preparation.
What is support and resistance?
Support and resistance are core concepts in technical analysis used by traders to identify potential price turning points in any financial market — stocks, indices, forex, commodities, or crypto.
How to find support and resistance levels?
Finding support and resistance levels is a skill every trader develops with chart practice. The goal is to identify price areas where the market has reacted multiple times in the past, because those areas often influence future movement.
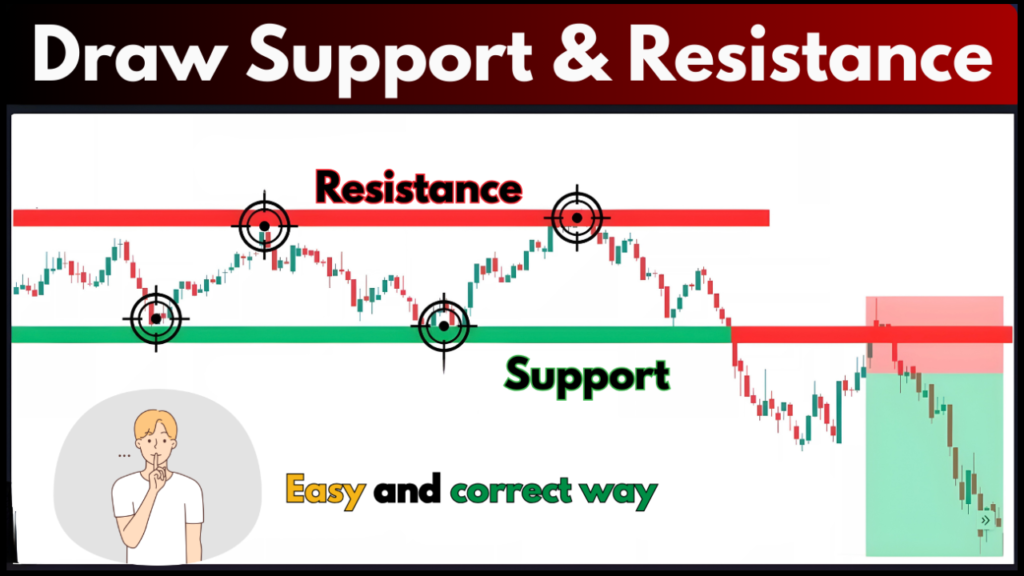
How to draw support and resistance lines?
Drawing support and resistance lines correctly is one of the most important skills in trading. The goal is to mark price zones where the market has reacted before, because those areas often influence future price movement.
- Support and Resistance Basics for Traders – Nifty50, Sensex, Bank Nifty, Gold, Cruid Oil
- Who is The Best Trader In India – Jai Kumawat Founder of Always Big Bull 2026
- What Is Trap Trading? A Complete Guide to Trap Trading in the Stock Market 2026
- Deepak Wadhwa Trader – Biography, Age, Net Worth, Lifestyle, Wife 2026
- Hammer Candlestick Pattern – Meaning, Type And All About 2026