
What Is Trap Trading? A Complete Guide to Trap Trading in the Stock Market 2026
Financial markets are driven by liquidity, order flow, and trader psychology. One recurring phenomenon that captures all three is trap trading. If you have ever entered a breakout trade only to see price sharply reverse against you, you may have experienced a market trap.
This guide explains what trap trading is, how it works in the stock market, the types of traps traders encounter, and practical ways to identify and avoid them
What Is Trap Trading?
Trap trading refers to a market situation where price action lures traders into taking a position based on a seemingly valid signal, only to reverse direction shortly afterward. The reversal forces those traders to exit at a loss.
In simple terms:
- The market creates a false signal.
- Retail traders enter positions.
- Price reverses unexpectedly.
- Early entrants are “trapped.”
These traps often occur near key support and resistance levels, breakout zones, trendlines, or high-volume areas.
Trap trading is not random. It usually develops from liquidity imbalances and large institutional order execution.
Why Trap Trading Happens in the Stock Market
To understand trap trading, you need to understand liquidity.
Large institutional players such as hedge funds, proprietary trading firms, and investment banks require significant liquidity to execute large orders. Retail traders often provide that liquidity.
When price breaks above resistance, many traders buy the breakout. This creates buy orders and stop-loss orders below. If institutions want to sell at better prices, they may push price slightly higher, trigger breakout buying, and then unload their positions. Once selling pressure increases, price drops sharply.
The result: a bull trap.
The same logic applies in reverse for bear traps.
Types of Trap Trading in the Stock Market
1. Bull Trap In Trading
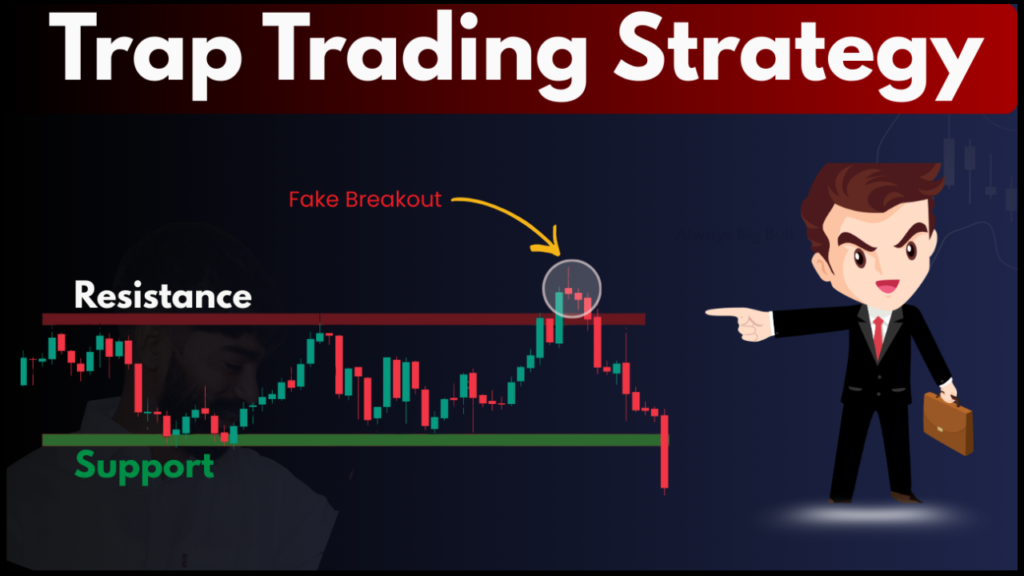
A bull trap occurs when price breaks above a resistance level or range high, encouraging traders to go long, but then quickly reverses downward.
Common Characteristics:
- Breakout above resistance
- High initial volume
- Sharp reversal within 1–3 candles (on lower timeframes)
- Long upper wicks
Traders who bought the breakout are forced to exit as price falls back below resistance.
2. Bear Trap In Trading
A bear trap is the opposite scenario. Price breaks below support, convincing traders to short the stock. Shortly after, price reverses upward.
Common Characteristics:
- Breakdown below support
- Panic selling
- Quick recovery above support
- Short squeeze potential
Short sellers become trapped as price rallies.
Trap Trading vs Breakout Trading
Breakout trading aims to capture momentum when price moves beyond a defined level. Trap trading exploits failed breakouts.
The key difference lies in confirmation and follow-through:
| Feature | Valid Breakout | Trap |
|---|---|---|
| Volume | Sustained high volume | Initial spike, then drop |
| Follow-through | Multiple candles continue | Quick rejection |
| Retest | Holds above/below level | Fails retest |
Understanding this distinction reduces false entries.
How to Identify Trap Trading Patterns
While no method guarantees accuracy, the following signals often indicate a potential trap:
1. Lack of Volume Confirmation
A genuine breakout usually maintains strong volume. If volume drops immediately after the breakout, caution is warranted.
2. Long Wicks and Rejection Candles
Candlestick formations such as shooting stars, pin bars, or bearish engulfing patterns near breakout zones often signal rejection.
3. Divergence in Indicators
If price makes a new high but RSI or MACD fails to confirm, momentum may be weakening.
4. News-Driven Spikes
Sharp moves triggered by headlines can reverse quickly once the initial reaction fades.
How Professional Traders Use Trap Trading
Experienced traders do not simply avoid traps; they trade them intentionally.
For example:
- When a false breakout occurs above resistance,
- And price closes back below the level,
- Some traders enter short positions targeting trapped buyers.
This approach is sometimes referred to as “fade the breakout” or “liquidity grab trading.”
However, this strategy requires precise timing and strict risk management.
Risk Management in Trap Trading
Trap setups can be volatile. Risk control is essential.
Best practices include:
- Using predefined stop-loss levels
- Risking a fixed percentage per trade (e.g., 1–2%)
- Waiting for candle close confirmation
- Avoiding emotional revenge trading
Without discipline, traders can fall into multiple traps consecutively.
Is Trap Trading Manipulation?
Not necessarily.
While some traders believe traps are deliberate manipulation, most trap formations result from natural supply and demand imbalances. Financial markets operate on liquidity mechanics, not fairness.
Understanding order flow provides better insight than blaming manipulation.
Conclusion
Trap trading in the stock market is a recurring pattern driven by liquidity, psychology, and market structure. Both bull traps and bear traps can cause significant losses for unprepared traders.
The solution is not to avoid trading breakouts entirely, but to:
- Demand confirmation
- Analyze volume
- Observe structure
- Maintain strict risk management
By recognizing trap conditions early, traders can reduce false entries and even capitalize on failed breakouts.
If you are active in equity markets, learning to identify trap trading setups is not optional — it is essential for long-term consistency.
What is trap trading?
Trap trading refers to a market situation where price action lures traders into taking a position based on a seemingly valid signal, only to reverse direction shortly afterward. The reversal forces those traders to exit at a loss.
What is bear trap in trading?
A bull trap occurs when price breaks above a resistance level or range high, encouraging traders to go long, but then quickly reverses downward.
Common Characteristics:
Breakout above resistance
High initial volume
Sharp reversal within 1–3 candles (on lower timeframes)
Long upper wicks
Traders who bought the breakout are forced to exit as price falls back below resistance.
What is bull trap in trading?
A bear trap is the opposite scenario. Price breaks below support, convincing traders to short the stock. Shortly after, price reverses upward.
Common Characteristics:
Breakdown below support
Panic selling
Quick recovery above support
Short squeeze potential
Short sellers become trapped as price rallies.
What is a liquidity trap in trading?
A liquidity trap in trading refers to a market condition where price moves into an area specifically to trigger stop-loss orders and pending orders, creating liquidity for larger participants — and then sharply reverses direction.
In practical terms, it is a liquidity sweep or stop hunt that traps retail traders on the wrong side of the market.
It is important to distinguish this from the macroeconomic concept of a liquidity trap (low interest rates and ineffective monetary policy). Here, we are discussing liquidity traps in technical trading and market structure.
- Support and Resistance Basics for Traders – Nifty50, Sensex, Bank Nifty, Gold, Cruid Oil
- Who is The Best Trader In India – Jai Kumawat Founder of Always Big Bull 2026
- What Is Trap Trading? A Complete Guide to Trap Trading in the Stock Market 2026
- Deepak Wadhwa Trader – Biography, Age, Net Worth, Lifestyle, Wife 2026
- Hammer Candlestick Pattern – Meaning, Type And All About 2026
Pingback: Support and Resistance Basics for Traders - Nifty50, Sensex, Bank Nifty, Gold, Cruid Oil - Always Big Bull