
What Is a Hammer Candlestick Pattern?
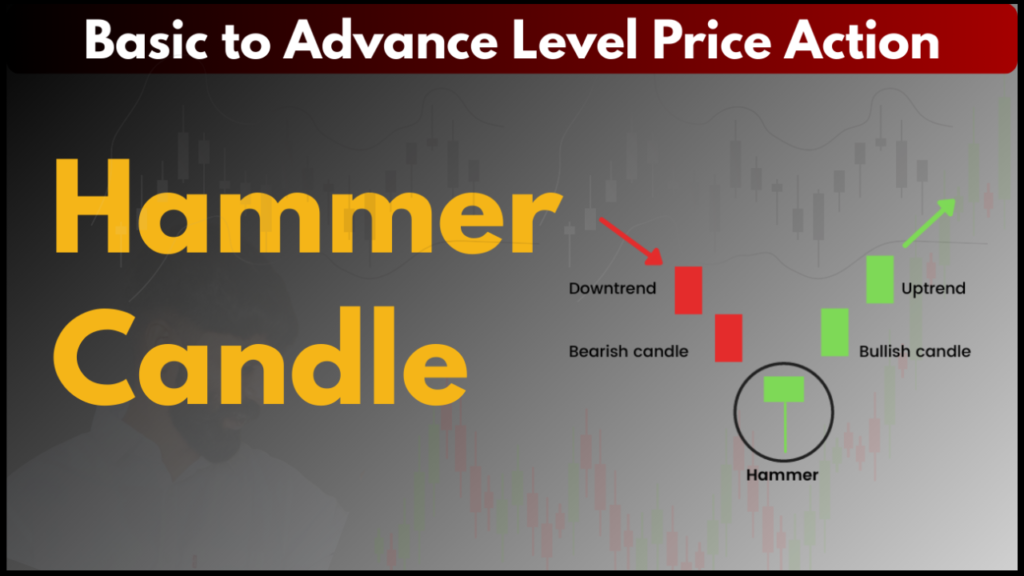
A hammer candle is a single candlestick pattern that appears after a price decline and signals a possible reversal to the upside.
Key Characteristics:
- Small real body (near the top of the candle)
- Long lower shadow (at least 2× the body size)
- Little to no upper shadow
- Appears after a downtrend
The structure indicates that sellers pushed the price significantly lower during the session, but buyers stepped in and drove the price back up before the close.
Watch Hammer Candle Full Video On YouTube👇👇
What Does a Hammer Candle Indicate?
From a market psychology perspective:
- Sellers dominate early in the session.
- Price drops sharply.
- Buyers enter aggressively.
- Price closes near the opening level.
This shift in momentum often suggests that bearish pressure is weakening and bullish momentum may begin.
However, confirmation is critical. A hammer candle alone is not sufficient to enter a trade.
Importance of Hammer Candlestick Patterns
- It could be used as a leading intraday indicator to signal a change in bullish/bearish momentum.
- This indication can either confirm or disprove the existence of a notable high or low. – Before closing back towards open, the price moves higher or lower, “hammering” out a top or bottom.
- The length of the shadow (preferably 2-3 times the size of the body) and the duration have increasing significance.
- Other reversal indicators may be confirmed or strengthened by hammers (i.e., may occur as part of the tweezer formation, or next to Doji, etc.)
- A hammer fails when the following candle makes a new high, and a hammer bottom fails when the next candle makes a new low
Types of Hammer Candles
1. Standard Hammer
Appears after a downtrend and signals a bullish reversal.
2. Inverted Hammer
Has a long upper shadow and small lower shadow. It also appears after a downtrend and may indicate potential bullish reversal, though confirmation is even more important.
3. Hanging Man
Structurally similar to a hammer but appears after an uptrend. It signals potential bearish reversal.
How to Trade a Hammer Candle
Step 1: Identify the Trend
The hammer is most effective after a sustained downtrend. If it appears in sideways markets, it carries less significance.
Step 2: Wait for Confirmation
Look for:
- A bullish candle closing above the hammer
- Increased trading volume
- Support level alignment
- Confluence with RSI divergence or moving averages
Step 3: Entry Strategy
Enter above the high of the hammer candle after confirmation.
Step 4: Stop-Loss Placement
Place stop-loss slightly below the hammer’s low.
Step 5: Target Setting
Use:
- Previous resistance levels
- Risk-reward ratio (e.g., 1:2 or 1:3)
- Fibonacci retracement levels
Hammer Candle in Different Markets
The hammer candle works across:
- Stock markets
- Forex trading
- Cryptocurrency markets
- Commodities
It performs best in highly liquid markets with strong trend structures.
Common Mistakes Traders Make
- Trading without confirmation
- Ignoring overall market trend
- Using it in low-volume environments
- Not managing risk properly
- Confusing hammer with hanging man
Hammer Candle vs Inverted Hammer
| Feature | Hammer | Inverted Hammer |
|---|---|---|
| Shadow | Long lower | Long upper |
| Bias | Bullish reversal | Potential bullish reversal |
| Strength | Generally stronger | Requires stronger confirmation |
How to start trading in 2026…?
Is the Hammer Candle Reliable?
The hammer candle is considered moderately reliable, especially when combined with:
- Support levels
- Volume spikes
- Technical indicators (RSI, MACD)
- Trendline analysis
No candlestick pattern guarantees success. Proper risk management is essential.
Conclusion
The hammer candle is a powerful visual representation of market psychology. It signals that buyers are stepping in after a decline, potentially marking the beginning of a trend reversal.
For best results:
- Always wait for confirmation
- Combine with other technical tools
- Manage risk carefully
- Practice on demo accounts before trading real money
Mastering the hammer candle can significantly enhance your technical analysis skills and improve your trading decisions.
Is a hammer candle bullish or bearish?
A hammer candlestick is a bullish reversal pattern, appearing after a downtrend to signal that selling pressure is weakening and buyers may take control, potentially starting an uptrend; it looks like a hammer with a small body at the top and a long lower wick, indicating strong buying pressure pushed prices back up, but its reliability increases with confirmation from subsequent bullish candles or indicators.
What happens after a hammer candlestick?
The unique shape tells traders that even though prices initially dropped, buyers stepped in to reverse the decline, pushing the closing price up to near the opening price. This signals a potential shift from bearish to bullish sentiment momentum.
How to use hammer candle in trading?
Price action traders can use hammer candles to predict probable reversals after bullish or bearish trends. These candle patterns may indicate a bullish reversal at the conclusion of a downtrend or a negative reversal after an upswing, depending on the context and timing.
How to confirm a hammer candlestick?
A hammer candlestick is identified by a small body at the top end of its range and a long lower shadow, which should be at least twice the body’s length. The upper shadow should be minimal or absent. The body can be red or green, with green often indicating stronger bullish potential.
What does red hammer candle mean ?
A bullish hammer candlestick can absolutely be red, though a green (or white) hammer is often considered a slightly stronger bullish signal; a red hammer means the price closed lower than it opened, but the long lower wick shows significant buying pressure overcame initial selling, still indicating a potential reversal from a downtrend. Both red and green hammers have the same basic shape (small body at the top, long lower shadow) and appear at the bottom of a downtrend, signaling buyers stepping in.
Key Points about Red Hammers:
Formation:
The candle opens higher and closes lower (red body), but strong buying pushes it back up significantly, creating a long lower shadow.
Meaning:
Sellers pushed prices down initially, but buyers rejected those lower prices, driving the price back up before the close, indicating waning selling pressure.
Strength:
While still bullish, it’s considered slightly less strong than a green hammer because the close was below the open.
Confirmation:
Like any hammer, it needs confirmation from subsequent bullish price action (e.g., the next candle opening higher) to confirm the potential reversal.
In essence, the shape and location (bottom of a downtrend) are crucial for the hammer pattern, and its color just tells you a bit more about the intraday price action, with red showing a small victory for sellers before buyers took over.
AI responses may include mistakes. For financial advice, consult a professional.
- Support and Resistance Basics for Traders – Nifty50, Sensex, Bank Nifty, Gold, Cruid Oil
- Who is The Best Trader In India – Jai Kumawat Founder of Always Big Bull 2026
- What Is Trap Trading? A Complete Guide to Trap Trading in the Stock Market 2026
- Deepak Wadhwa Trader – Biography, Age, Net Worth, Lifestyle, Wife 2026
- Hammer Candlestick Pattern – Meaning, Type And All About 2026
Pingback: What Is Trap Trading? A Complete Guide to Trap Trading in the Stock Market 2026 - Always Big Bull